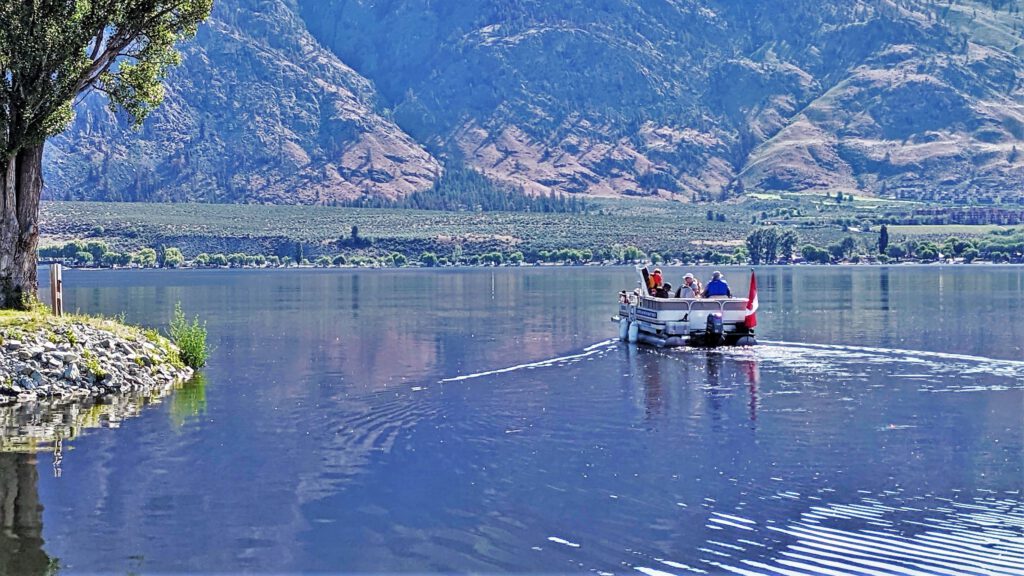
Thanks to the hard working volunteer crews and pontoon boats captains of the Osoyoos Lake Water Quality Society, the results are in for the summer of 2022.
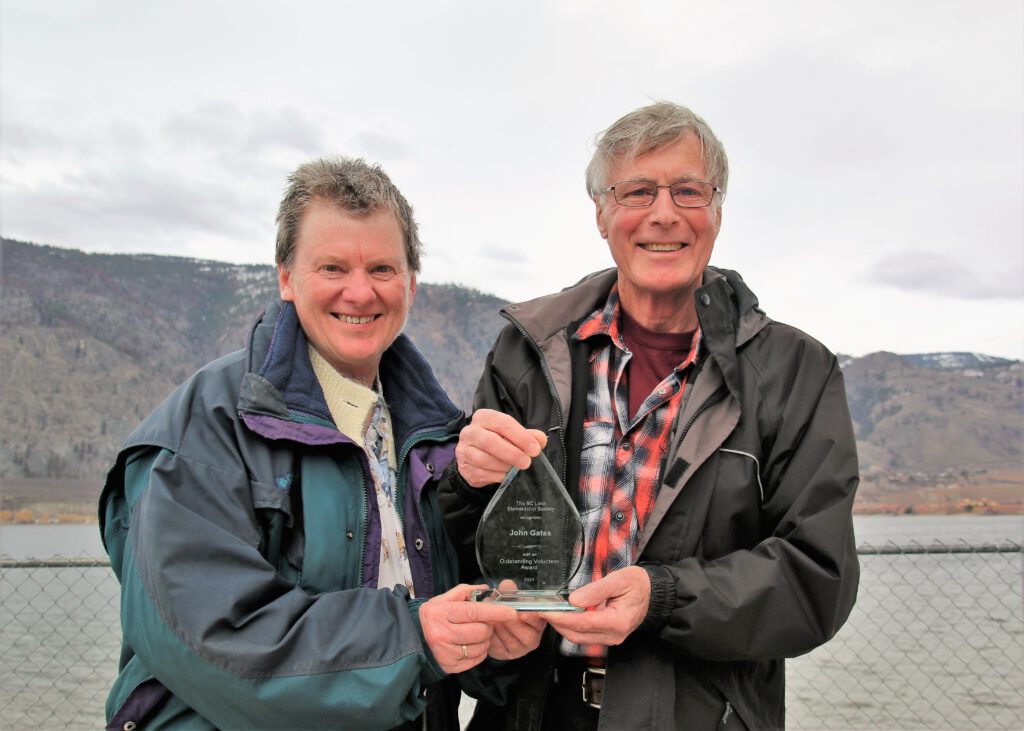
Under the watchful direction of John Gates, the OLWQS has assembled water data from four areas on the Canadian side of Osoyoos Lake. that include the South Basin; Central Basin; White Sands and Packing House locations on Osoyoos Lake. The results are also shared with BC Ministry of Environment and others.
Below are the water test results for 2022, by are on Osoyoos Lake